How old is someone born in a leap year, on February 29th? I guess it matters how and when you start counting. The current Bull Market started March 9, 2009. By most any measure, this Bull Market is now the longest running at 3,463 days. It achieved its “longest status” on August 21. Amazing though, this Bull Market is often not considered one. Not many believe in it and some stubborn skeptics still refer to it as a strong rally. Perhaps that is because many investors were under or un-invested during much of these years because of the two Bear Market drawdowns of almost 50% in 2000 and 2008. Many were afraid to re-invest following severe portfolio value loss and market volatility. Trying to time the market by following emotion is most always a very dangerous strategy and often results in a bad investment experience.
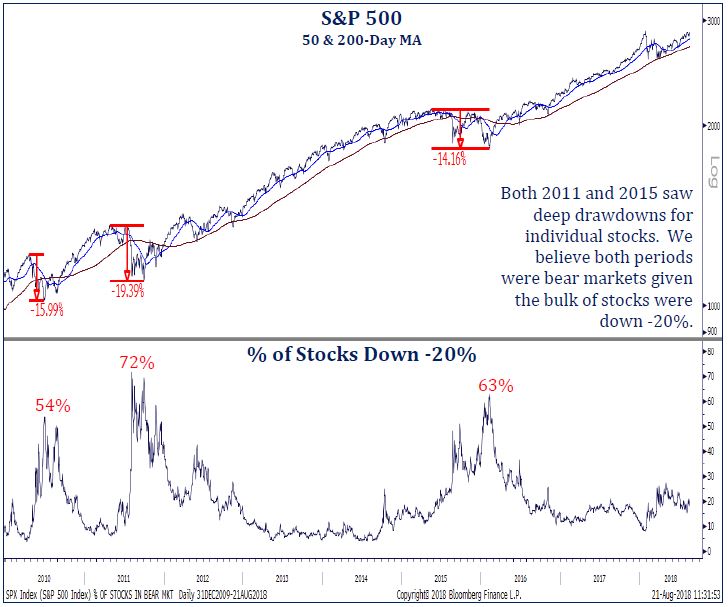
Some market watchers question the age of the current 10-year old Bull Market, saying it ended in 2011 or 2015. To be the oldest, it matters when you start counting. Obviously, if the Bull Market ended in 2011 or 2015, the count was “reset”, and the previous “oldest” title still belongs to the period spanning 1990 and 2000. Some cite that the S&P 500 experienced deep drawdowns wherein 70% of stocks were down -20% or more in 2011 and 63% were down more than 20% during 2015 (see S&P chart to the right). The Russell 2000 (small company) index was cut by -30% in 2011 and -27% in 2015. It’s also important to note that global stocks experienced severe declines. While the total S&P500 index did not drop to/beyond the -20% threshold, many market indexes around the globe reset during 2011 and 2015-16. Recently, the S&P500 started its current rally on February 11, 2016; thus it is barely 2 years old and running. We all know that when using numbers, one can prove almost anything. It matters when you start counting. For most, the current Bull Market is still running. It is not the most powerful advance – up over +335% compared to the previous longest (1990 to 2000) advancing +417%.
Market factoids aside, August produced another surprising positive performance month for the stock market. Often, the summer months are soft. The old stock market adage advises to “sell in May and go away” or “nothing really happens during the dog days of summer.” Yet, this year, May – August were all positive performance experiences for US stocks. During August, the S&P500 returned to its January 26 high following a 6-month correction process, and moved above it with 8 new daily highs. That was not however, the experience for international stocks, as tariff talk and negotiations influenced foreign market action. Bond market performance was soft in August, and is still a challenging environment for investing as the Fed is normalizing (raising) interest rates in a steady pattern. Client portfolios experienced continued slow performance advances during August, and best performance was again enjoyed by those areas already more richly valued (expensive). [If you missed our commentary last month entitled “Extremist”; it explains wide performance differences among asset classes (Click Here).]
Domestic political turmoil – which seems ever present and accentuated with tariff talk – plus global economic (and market) weakness is raising suspicion among investors that US equity markets could be approaching a turning point. The divergence between US and the rest of the world stock markets is notable. At the same time though, corporate America appears in very good shape. But worry is something investors do well; and they are building their “case” for more defensive portfolio tactics.
Additionally, many market strategists worry about the new Fed, its policy of slowly tightening interest rates. As they watch the bond market yield curve, they observe the yield curve spread is very narrow. The yield difference, or pick-up by owning the 10-year instead of the 2-year Treasury is a very tight 20 basis points (or 0.2%). History shares that if the yield curve inverts, wherein the short term interest rate is higher than long rates – the spread is negative – the economy slides into a recession within a year or two. And, if the economy recedes, the stock Bull Market comes to an end. Negative spread signifies a policy mistake is being made and raises recession risk. A flat yield curve is okay, but inverted is not. History also shares that when the Fed raises interest rates, it can take some time before a Bull Market falters because the yield curve flattens and/or spreads narrow (before inverting).
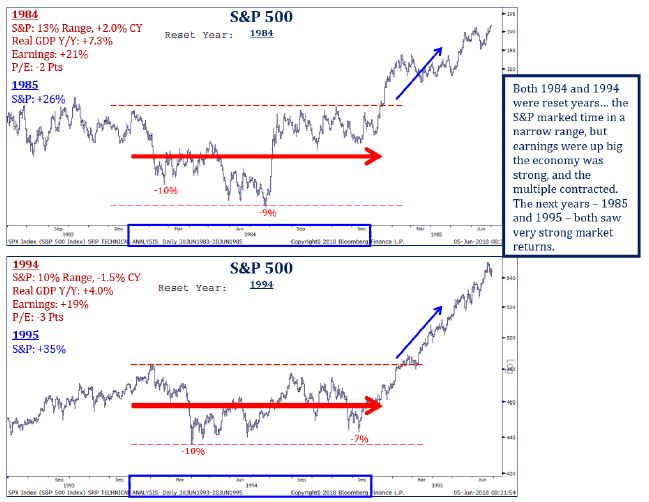
Two examples of this were in 1984 and 1994. During 1994, the Fed raised interest rates 300 basis points, or 3%. The yield curve flattened to just 8 basis points (0.08%) difference between the 10-year and 2-year Treasury; but it did not invert. During 1994, the stock market varied up/down within a 10% range; range bound. Economic growth continued at 4% and company earnings rose +19%. When 1995 started, the stock market advanced upward rising +35%. The almost identical occurred in 1984; then the stock market rose +26% in 1985. History reveals the economy can continue to grow when interest rates are raised (just not too much, too quick), and stocks will respond to those underlying fundamentals albeit when the yield curve does not invert.
Did you know? Again, historical numbers demonstrate that “it matters when you start counting.” Did you know that the highest closing value during the year for the S&P500 occurs most often in the final 4 months of the year (September – December) in 12 of the last 15 years? That’s 80% of the time! And, in mid-term election years when many in Congress are up for re-election, the market demonstrates an end-of-year rise since 1950 when looking at data; performance is back-end loaded. Will these stats prove true as we wrap up 2018 (following an attractive summer of performance)?
We still think the US economy has momentum and is headed for its longest expansion on record. The tax cuts in December are boosting GDP growth by about 1.2%, now boosting the total GDP toward a 4.2% annual rate. The impact of fiscal policy on the economy also allows the Fed to normalize without much noticeable domestic hit. It’s difficult to find a problem in the US economy now, but it is easier to see some troubles abroad. Inflation, financial conditions (including the currently strong US dollar), and international developments do matter. The weakest links in the chain break first – that could occur in more leveraged debt-oriented countries. Keep a careful vigilant watch on underlying domestic and global economic fundamentals. Domestic fundamentals still provide support which should allow the current US Bull Market to continue its historical run, baring a policy mistake (tariffs and/or interest rate normalization).
The following questions and answers were offered by Strategas Research Partners, from which we subscribe to receive their investment research.
Q: Can a bear market in Emerging Markets and Europe occur without weakness spreading to US stocks?
A: Looking historically, the mid-1990s provide a view for today. US stocks held their own during a -33% rout in EM and a near -20% pullback from European stocks during 1994-1995. In 1997-98 during an EM crisis, the S&P500 experienced a bigger hit, but quickly recovered to new highs. Recall too, 1990 to 2000 was the previous longest running Bull Market (now second to the current), when EM struggled.
Q: How close is EM to washing out? What about contagion to Europe?
A: EM is getting close…markets are broadly down about -20% from the January highs (when tariff talk began). The magnitude of this pullback is not as extreme as in 2011 and 2016 corrections, the % of stocks above their 200-day moving average (currently 35%) is getting closer to where major lows take shape (roughly 20%). Europe is also weak (much relating to tariff talk), but is approaching a supportive period (October through year-end). Fewer stocks are making new lows (good indicator of a bottoming by the stock market). Various research we receive suggests that Europe is appearing undervalued (relative to the US market), and offering attractive long-term return opportunities. Tariff talk resolution will be a key catalyst for foreign, and for Europe in particular; foreign is setting up for advancing nicely. The worry though, is if tariff talk takes too long, then economic growth could falter.
Author: Bill Henderly, CFA – September 7, 2018
Printer-Friendly PDF can be downloaded here: “It Matters When”
Interesting Charts: