The 1st quarter was one of the strongest starts to a new year in the last two decades. It followed an equally unsettling period over the final 3 months of 2018 which significantly damaged investor sentiment, making the swift rebound another textbook example revealing just how challenging would be market timing. This quarter’s newsletter contains four brief articles. “Reflections on a Bull Market” and “Age is Just a Number” provide perspective on the progress of the current bull market and economic cycle, respectively, which are both long by historical standards but need not die due to age alone. “No Beauty Contest” shares why the treasury yield curve is an indicator investors are monitoring closely, especially now, while “Style Differences Exist” provides color about how we are positioning client accounts with consideration for managing portfolio risk.
The full printer-friendly version of our newsletter, including data tables for selected mutual fund and ETF performance as well as portfolio benchmarking, can be downloaded here: NVEST NSIGHTS 1Q.
REFLECTIONS ON A BULL MARKET
Bill Henderly, CFA, Nvest Wealth Strategies, Inc.
As investors recall, the January-February start to 2019 was one strongest starts since 1991 because the Fed announced a pause to its process of raising interest rates. This helped stocks recoup much of the losses from last year-end. March added another +2% total return and boosted the S&P500 return for 1Q2019 to +13.6%. Since 1926, the Index delivered double-digit returns in the first quarter 14 times. Only 4 years did the market fail to post +20% for the full year (1930, 1986, 1987 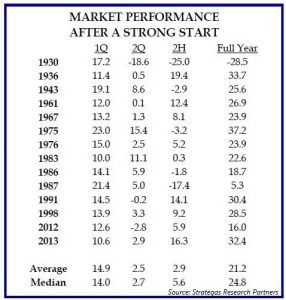 and 2012 – see chart to right). Very often a pause in the upward path occurred in the subsequent 2Q. A 2Q pause could develop this year because… either a delay in a trade deal with China develops that is longer than expected, and/or first quarter company earnings announcements are soft relative to current market valuations. Interesting, the 1Q bounce back created a “V” shaped chart pattern following the challenging drawdown of the 4Q2018, and December in particular. “V” shaped chart patterns are unusual, with a “W” shaped chart pattern more common. A pause for the reasons cited above could cause the stock market charts to create a more normal “W” pattern. In essence, a strong 1Q stock market performance often leads to slower but continued gains.
Did you know? The current Bull Market celebrated its 10th birthday on March 9th, gaining over +400% in that time period.
- The 2 best years (out of the 10 years) were the 1st (up +72.3%) and the 5th (up +23.7%).
- The 2 worst years were the 7th year (down -2.2%) and the just concluded 10th year (at 3/8/2019 rising a small +0.4%).
The 10-year annualized return amounts to +17.5% per year (total return of price change + dividends). While this is perhaps the least loved or admired bull market, and many investors are most skeptical of its prospects, it would be easy to miss the 20 best days (of the total 2,517 trading days). If one missed the 20 best trading days (not 20 days per year), the annualized gain is cut in half to +8.6%. Not shabby; yet affirming that timing the market is not profitable (not worth the psychological worry effort).
Did you know? Since 1950, there are 60 different 10-year periods (the years 1950-1959; 1951-60; 1952-61; through 2009-2018). These 10-year return stats for the S&P500 are compelling:
- The index produced an average annual total return (dividends + price change) of less than +7% during 15 of the 60 decade-long periods, or 25% of the time.
- 19 of the 60 periods (or 32% of the time), resulted in an average total return of at least +14%
- The S&P500 produced a positive total return result in 58 of the 60 decade-long periods. That’s 97% of the time!!
Again, these historical stats strongly advocate the merits of being a long term, in-the-market investor.
AGE IS JUST A NUMBER
Later this 2nd quarter, the current economic expansion will reign as the longest of all time. Earlier on March 9th, the bull market celebrated its 10th anniversary. No one would describe either as young as far as time. Former Fed Chairman Ben Bernanke offered at the start of the year that “economic expansions don’t die of old age, they get murdered.” Mixed economic data in the US and weak data abroad suggest that the Fed should not be too quick to raise interest rates further or tighten monetary policy. The Fed learned that there are limits to how quickly it can normalize interest rates and monetary policy in a global environment that is still attempting to escape the hold of financial repression (low or zero interest rate policy to boost economic growth). Thus, the Fed is unlikely to be charged with the crime of killing the economy and current Bull market any time soon.
The Administration blunted the full positive impact of the tax cuts (of December 2017) with a continuation of trade/tariff negotiations with China, and the recent government shutdown (over funding the southern border wall, which would be an economic boost) to start 2019. The cumulative effect of these slowdown issues produced a tough 1Q for businesses globally (creating uncertainty in executing future plans and soft 1Q earnings reports), but offers hope about the future as policy resolution develops. At the same time, China is pursuing efforts to stimulate its own economy. Thus, several global policy stimulation actions, including prospective tariff and Brexit resolution, should lead to a stronger global second half. The current economic cycle and Bull market will likely celebrate another anniversary event that suggests neither needs to die of old age; or “age is just a number,” at least at this time. Both die when policy mistakes – either fiscal or monetary policy – are made.
NO BEAUTY CONTEST
The Treasury yield curve inverted in late March due to worries about slowing economic growth. [Worth mentioning that slower economic growth often occurs during the 1Q of most years, but rebounds thereafter.] Many times through US economic history, the yield curve inversion signaled a recession somewhere in the upcoming future – maybe within a year or two at most. An inverted yield curve means that short rates are higher than long rates. Normally, the shape of the yield curve is upward-sloping, and can be interpreted that rates will gradually be higher in 2, 3, or … 10 years in the future than current short maturity rates. An inverted curve with short rates higher than long rates could be interpreted to mean rates in 10 years will be lower than current short rates, because there is low or anticipated low inflation and/or slow economic growth. Further, it means the Fed made a policy mistake – raising interest rates too fast too much. At this juncture, a few weeks of inversion should not be the “red alert” for a definite future recessionary event. The yield curve would need to remain inverted for a continuing period of time.
Inversions are unnatural events that signal a policy mistake. It’s not unusual for the US yield curve to invert every cycle, because the Fed makes a policy mistake at least once every cycle. Over the last 40 years, recessions occur because the Fed kept tightening even after the yield curve inverted. The key for the Fed is to not invert the curve. But, once it’s inverted, the Fed should stop raising rates or tightening, hoping that their pause is early enough to allow the economy to regain its growth path. It may be too early to know if their pause is timely or not. Let’s hope the inverted curve was the “stop sign” for the Fed to pause and watch economic developments, and thereby avoid a recession.
One side effect of the yield curve inversion and recent Fed pause is that the whole curve shifted itself lower than at the start of 2019. Meaning, consumers are finding interest rates lower at the end of March than at the start of the year. Auto and home sales are increasing again as consumers take advantage of lower rates. This too supports the notion that economic growth should advance again in the 2nd half of 2019 and support stock market prices.
In any case, the current yield curve inversion will not win any beauty contests with investors.
STYLE DIFFERENCES EXIST
Amazing! The S&P500 provided a “full year” size return in the 1Q2019 alone. This fast pace is unlikely to continue for the balance of the year. While the market offered attractive valuations at year-end, following the 1Q rise investors should once again be aware of higher prices. It is important to monitor economic developments and other policy actions to verify this Bull market can advance its historical run.
Our portfolio management process is employing a “dial-down risk” strategy. We know “Age is Just a Number.” We know the Bull market can run longer than 10 years, IF economic fundamentals provide continuing support. As portfolios incorporate a dialed-down risk in both bond and stock exposures, it is interesting to observe fund style performance differences. Both US domestic and foreign (EAFE) growth style stock funds are continuing to perform better than value style funds (see “Growth v Value” chart to the right). Valuations of growth style funds are rich or 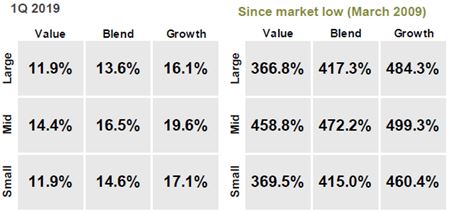 stretched compared to value. That means risk is elevated for growth versus value. Diversifying a portfolio still requires owning both growth and value style stock funds. Dialing-back risk advocates capturing some profits from more expensive growth style stock funds to reduce their portfolio exposure. Then, redeploying the proceeds first, to retain the stock/bond allocation target per objective, and second owning value style stock funds where the risk/reward appears better. For now, this Bull market is without an expiration date, but we know that managing risk is very important at this stage in the cycle.
Pursuing less risk may result in slightly slower advancing portfolio values during a rising market environment. Yet, if style performance shifts to favor value, those exposures will provide a nice boost to portfolio appreciation. Or, if/when the market does pull back the lesser-risk, value-style stock funds should provide better downside protection in portfolios. Nvest tries to be dynamic and disciplined with our investment process.