Challenges exist for anyone playing sports when they are “behind in the count.” It’s a common experience for all athletes. Pressure builds for example, when batting with a count of “no balls and two strikes”, or behind in the football score 21-0. No competitor likes being behind, and extra effort may be pursued to bring about a positive winning outcome. Competitors strive for opportunity to succeed. Isn’t that the way with most things in life – pursue success, not failure?!
The recent rally in stocks (from the June 16 low to August 16) was not the start of a new bull market. It was a welcome +17.7% respite from the first half market declines. It provided a reminder how sudden and fast rebounds can occur. Bear market rallies are sometimes referred to as a “dead cat bounce.” This rally occurred during/in a bear market environment which is provoked by aggressive Fed tightening action to battle high inflation, plus many geo-political issues around the world. History shows there can be several rallies during a bear market drawdown. Current market action remains labored; rallies lack excitement or exuberance. Bear markets often experience testing of a low that further “washes out” investor sentiment, sometimes creating a feeling of irrational exasperation. At some point even as news remains troubling, know that the market will start a new bull run. We will not receive an “all clear” signal for the start of a new bull market.
Bonds and stocks ended August with troubled spirits. Prices were ahead for part of the month, and then fell behind “in the count.” Some investors thought the Fed might start to slow or pivot its recent aggressive path of raising interest rates; maybe “peak inflation” was occurring. By mid-month, Fed comments became more direct – future rate increases would be aggressive until sticky inflation receded, even if action creates “pain for the economy and consumers.” Stocks retreated to close the month down -4.1% (declining -8.1% from August 16th); bonds lost -2.8% as investors repriced yields higher (price of bonds fall as rates rise). Only energy was positive. Portfolio gains in July were reduced by the end of August pullback.
Let’s consider several influences for current and near-term market action:
- 2020 aftershocks are upending the monetary, fiscal and geo-political backdrop for investing. In 2020 four transformational policy events occurred in the same year; that’s a rare experience – a pandemic; a recession from the Great Lockdown (during COVID); mass protests; and a new president. Each brought significant policy changes.
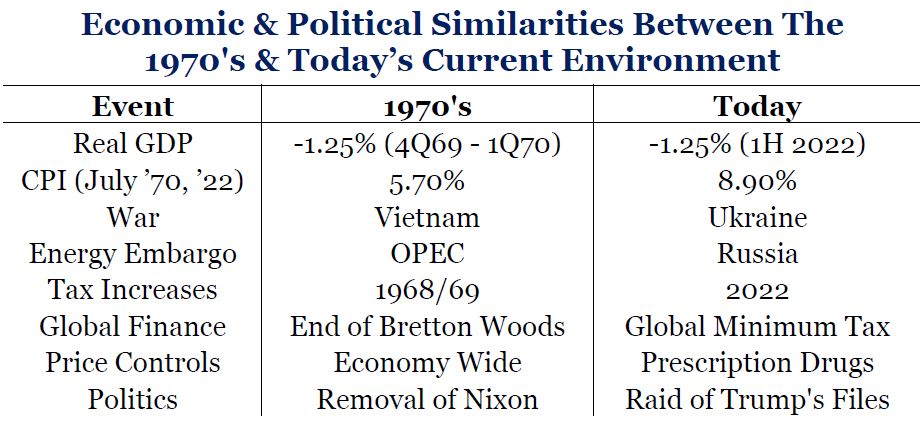 All 4 at once levy impact on public policy that reaches outside the comfort zone. [Similar happened in 1968/1969 with war, an energy embargo causing high inflation, elimination of Bretton Woods financial system, price controls, and removal of a sitting president.] Today – the big themes: inflation; de-globalization; geo-politics (Russia and China’s challenge to world order is intensifying). These are not “bearish” events, but change the backdrop. (table of 1970s v today – see table to the right/below)
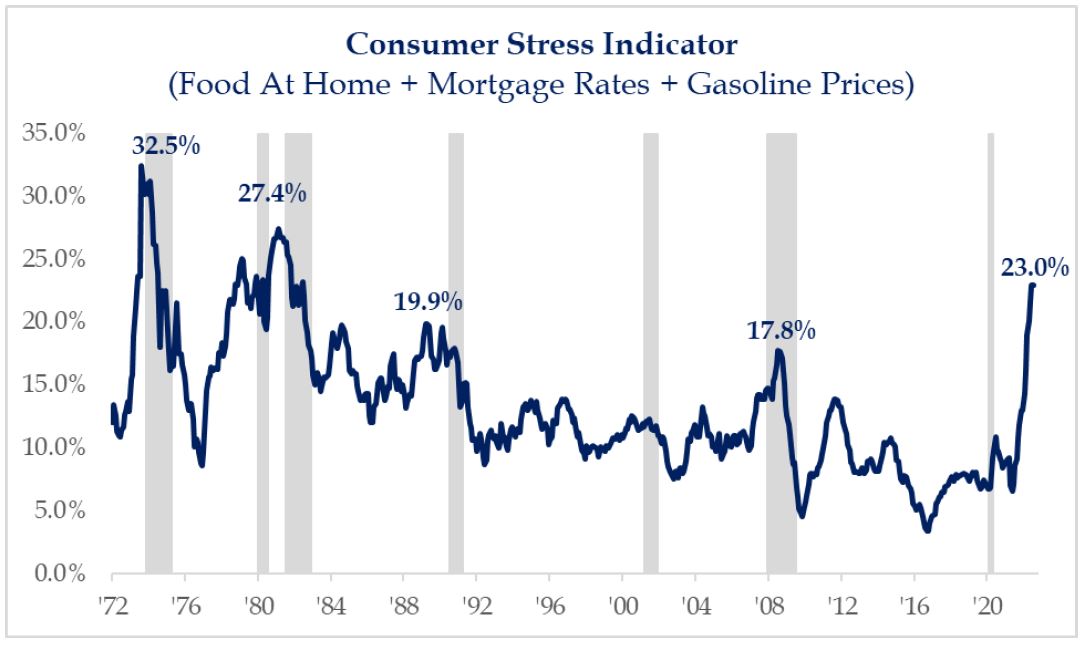
 - Inflation is proof of a policy mistake – consumer demand far exceeded supply from the Great Lockdown. Now, rising prices (inflation) and rising interest rates (to combat high inflation) will curb demand at some point. In August, the Consumer Stress Indicator (incorporates food at home + mortgage rates + gasoline prices) reached +23% (prices for food at home rose +13.1% in August from a year ago; gasoline prices declined; may be predicting an economic slowdown with reduced demand). The chart shows consumer stress is higher than 2008; it’s approaching the 1981 high when interest rates hit 16%; and the all-time high in 1974 when oil prices quadrupled. Current Consumer Stress is occurring during full employment. Other highs in the ratio occurred before or during a recession (shaded gray lines), when unemployment was also rising. Limited stock performance occurred during prior spikes in the stress indicator.
- Energy (Russia’s economic warfare) is impacting Europe and will impact the US, creating a full-fledged energy crisis; a recession in Europe is likely.
- Energy (Russia’s economic warfare) is impacting Europe and will impact the US, creating a full-fledged energy crisis; a recession in Europe is likely.
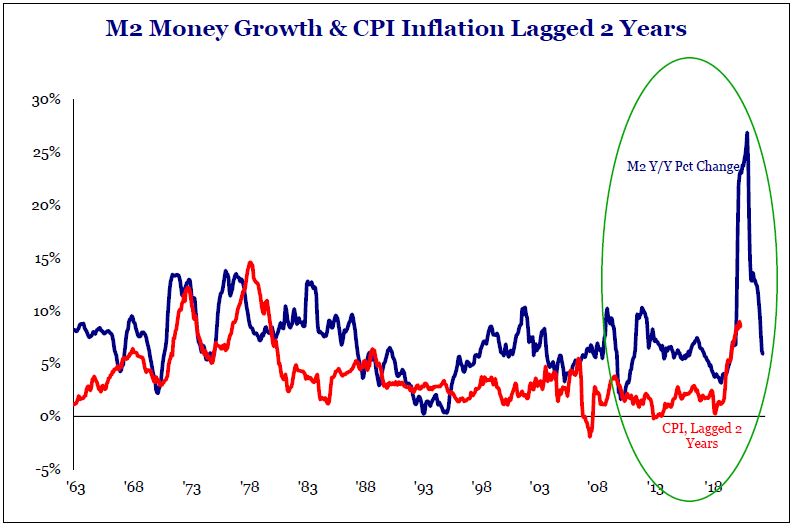
- Money supply (M2) growth (velocity of money) is slowing fast. Following the Great Lockdown, M2 grew near +40% while the economy did not need that much money to finance growth because it was not fully “open” or growing. Excessive M2 was “rocket fuel” for the stock market rise. It was the catalyst for current high inflation – boosting demand far above supply of products/services. Now M2 is growing at +5%. That means economic growth and demand will slow, and probably most components of inflation. With interest rates rising and M2 slowing, “peak inflation” is probably occurring.
- Inflation lags money growth (M2) by about one to two years. Core inflation may prove sticky or stubborn – rents, wages (labor market is still overheating) and food + energy will remain inflation challenges for the Fed – how much, far and fast must they raise interest rates to bring it back to the ~2% level?
- Inflation lags money growth (M2) by about one to two years. Core inflation may prove sticky or stubborn – rents, wages (labor market is still overheating) and food + energy will remain inflation challenges for the Fed – how much, far and fast must they raise interest rates to bring it back to the ~2% level?
- Fed policy action is “behind in the count,” moving toward neutral, but not there yet. Peak inflation” does not mean mission accomplished. There’s evidence that demand and economic growth is slowing. But until supply catches up, restraint is required to bring core inflation under control. Anchoring inflation expectations is a process not yet complete. The Fed just ended easy monetary policy (zero interest rates and Quantitative Easing); is now tightening by raising interest rates, trying to approach neutral. Neutral will occur when short-term interest rates roughly equal the rate of inflation- as/when short rates are increased to between 3.5% and 4% and because inflation is falling toward those levels. Curbing sticky inflation requires demand destruction.
- The challenge for the Fed and investors is the fact that monetary policy does not reveal its progress quickly; policy action produces economic and consumer demand change with a lag effect. So, the Fed won’t know its success until many months after. [Hope it’s not too far/much].
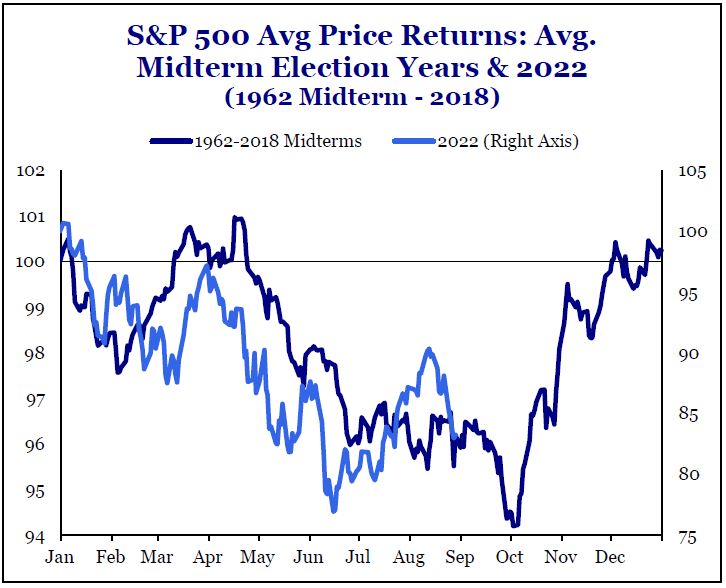
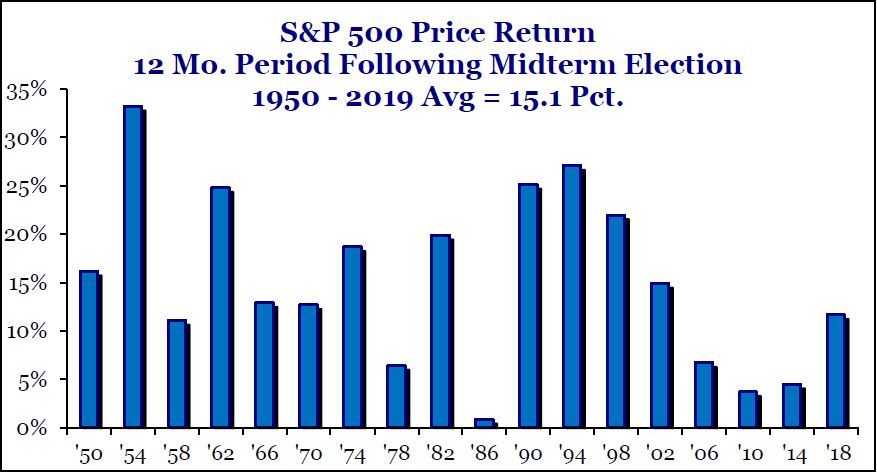
- Mid-term election years are historically tough for equity markets. The average intra-year decline for the S&P500 is -19%. Thereafter, the “good news” shows stocks rising in the 12 months following. This year, stocks are trending directionally like a typical midterm election year, but with greater declines. Also encouraging, history suggests we are approaching the 3 best quarters for average stock performance in a president’s term. There were 2 times (1974 & 1978) when high inflation and Fed & Fiscal policy mistakes prevented market rallies during the next 12 months; both times also included recessions. (see several charts relating to midterm/Presidential cycle at the bottom of the article)
- Stocks lead the economy by about 9 months; stock prices will improve before all news is known. Before the Fed concludes its tightening monetary policy, stocks will advance higher. [Stocks are a leading economic indicator; inflation is a lagging economic indicator.] This is important to understand; even if “behind in the count, we cannot win if removing ourselves from the game”
News moves the markets, up or down. Good news and bad news does not always move the market as might be expected. Presently, “good” economic news (like low unemployment rates or full employment) is deemed as “bad” news by the financial markets, both bonds and stocks. That’s because of the current monetary policy being pursued. The Fed and other central bankers will find cover to continue aggressive interest rate increases when strong economic news exist. That’s because inflation will be more challenging to whip when economic conditions are strong (good). Similarly, really bad economic news would also be unwelcomed because it suggests the Fed “killed” the economy. With such good/bad news conditions, market volatility will remain elevated; that too can be worrisome. We need news that is not too good (hot), not too bad (cold); but “just right”, like Goldilocks prefers things. Challenging times exist for the moment.
During “rainy day” times of uncertainty, defensive stock sectors will likely show the best relative (to the S&P500 index) performance. They are not new leadership for a new bull market cycle. Our tactical portfolio focus is pursuing “cash flow.” It means owning high-quality bonds that are reinvesting at higher interest rates, and owning stocks paying cash (growing dividends) which is preferred to non-dividend growth-only stocks. Dividend and interest income are buffers during “rainy day” markets. We reject the idea to engage in widespread selling based upon scary tumbles, or even fears of an economic recession. Appropriate diversification and some (small) tactical adjustment can assist to reduce the impact of any downturn. It is very appropriate to keep/take a long-term view particularly when others won’t. Warren Buffett is often quoted, “Be greedy when others are fearful; and fearful when others are greedy” (chasing new highs). We are watching for the return of “sunshine”; we know it is coming. We want to be invested when one of the upcoming rallies proves to be the start of the next bull market.
Printer-Friendly PDF: Behind in the Count – Sep2022
Chart References:
There are a number of economic and political similarities between the 1970’s and today. It is typical for stocks to experience weakness thru the summer in a midterm election year. 2022 (below) is similar except that at times more painful. Recovery often occurs as election approaches, and better performance continues into the following year.
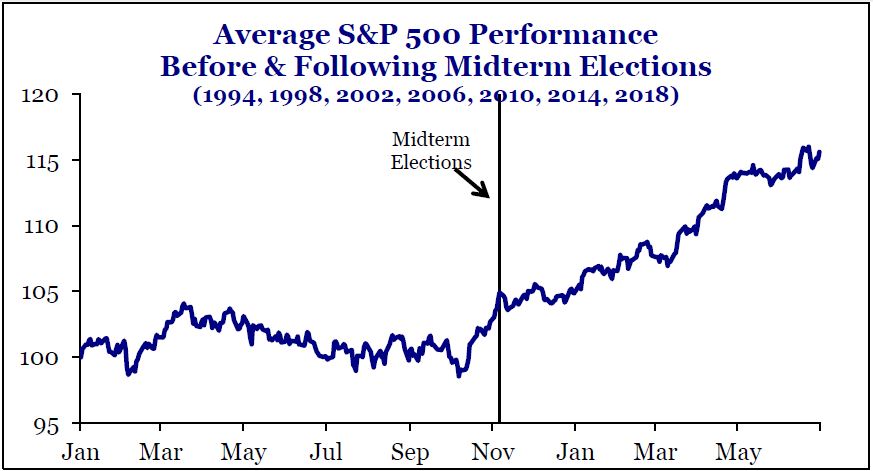
Perhaps providing hope… every 12-month period following a mid-term election since 1950 was positive. But performance was weaker than average when inflation was rising.
At the same time, we are approaching what are historically the strongest 3 quarters of the 4-year presidential cycle.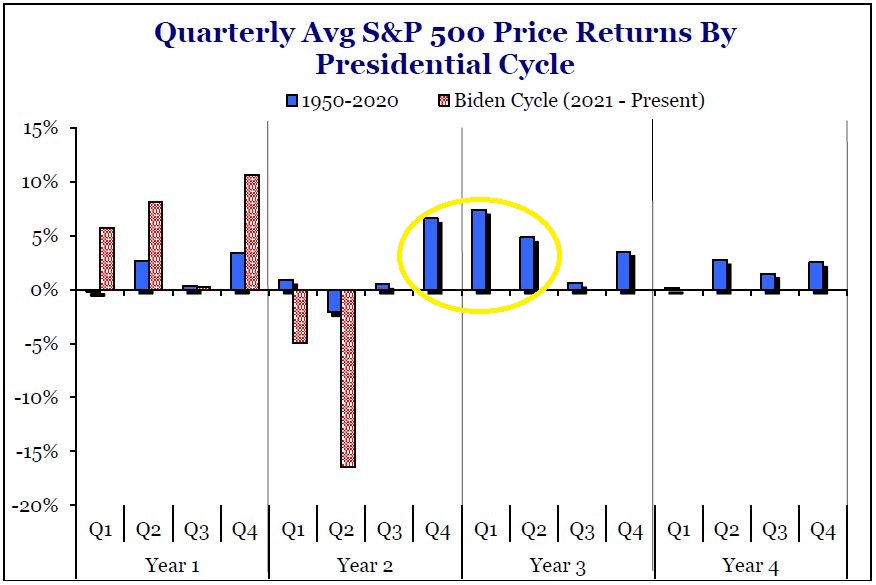
Bill Henderly, CFA | September 6, 2022
Chart sources: Strategas Research Partners