When your “check engine” light is displayed it usually means the car’s emissions control system is faulty and the vehicle is polluting the air beyond allowable federal standards. A vehicle with this condition would likely fail an emissions inspection. Common causes include a gasoline cap that is loose, oxygen or mass airflow sensor is bad, spark plugs may be caking with too much carbon buildup, spark plug wires are bad, or the catalytic converter is faulty (rare). You should not confuse the “check engine” light with the maintenance or service light; those signal a more immediate condition and should be promptly diagnosed.
At present, one of the investment market’s “check engine lights” is illuminated. That indicator is the bond yield curve; it changes shape from time to time, but is ordinarily upward sloping (charting bond yields maturing from 1 month to 30 years). It suggests, or some would say predicts, future economic and inflationary outlook. Sometimes this concept is referred to as the “expectations theory of the yield curve.” [I promise, this is not going to be boring or technical.] When the yield curve steepens (long maturity rates are much higher than short), it is inferred that faster economic growth and/or rising inflation is anticipated. That was the case in the first 12+ months of this new bull market (beginning March 23, 2020). After the 10-year Treasury bond approached 2% earlier this year, June and July ushered in a swift reversal with yields dropping to 1.15%, and the yield curve becoming flat (not much yield difference between short and long maturity). That’s a huge drop in a very short period when many would guess just the opposite on the notion huge stimulus spending by the government will boost economic growth and create rising inflationary conditions. Now, a flattening yield curve scenario is occurring in domestic and foreign bond markets. What’s the yield curve saying? It suggests 1) slower economic growth, and 2) less inflation in the future. This aligns with the evolving consensus perspective that the economy is peaking; the fastest recovery point for this cycle may be ending as new COVID Delta cases are rising and stimulus is fading.
2Q GDP surged an eye-popping +13% in nominal terms (including inflation effects of +6.1%); the difference of +6.5% being real (after inflation) GDP growth. When is 6.5% real GDP growth inadequate? Answer: when it’s “yesterday’s news” – it probably represents peak everything. Numerous economic data points appear to be peaking, or at high levels that create a big challenge to maintain or repeat – M2 (money supply) growth was +30% from the historic fiscal and monetary stimulus experimentation; orders of durable goods, capital goods shipments, and etc – all are slowing. Even companies like P&G recently forecast slower future revenue and profit growth due to supply-chain problems, higher transportation/shipping costs and delays, and inflation of raw materials. Peak productivity will decline causing the rate of profit growth to slow. Year-over-year analysts’ earnings growth was forecast at +16.7% on January 1st and is +10.3% on August 1st. At the same time, the mention of shortages is rising with no sign of slowing down; that usually means rising prices (inflation). Also, the US is facing its largest fiscal contraction since 1947 following the end of WWII, as stimulus measures expire or roll off. The US hit peak stimulus in March and is facing a fiscal drag, even with the prospects of new infrastructure spending with such spending will occur over 8-10 years (it takes time to build or improve roads and bridges). Prospective tax increases would further slow economic conditions if/when instituted. Current +6.5% GDP growth is inadequate when the future prospects appear softer or at a slower pace. This does not mean that investment conditions will turn bad; it just means the rapid early rise of the market rise should slow its advance this year (the 2nd year of the new bull market advance) and be softer or more normal in year 3 and beyond. Since mid-May, the check engine light is on because US economic growth is probably as strong as it gets.
Monetary conditions in the US and foreign economies remain loose, the most accommodative on record. Because of this condition, the idea that growth is slowing (not negative growth) does not mean a sour outlook is ahead. Rather, rising inflation and new COVID worries are contributing to the slowdown scare. If recent inflation proves stubborn, then the Fed will need to curtail or end its ZIRP (zero interest rate policy) and QE (quantitative easing – bond buying program). The Fed is willing to let inflation and the economy run hot for a short time to aid return to “full” employment. But allow it to be too hot for too long, and inflation can prove sticky and hard to reduce. Altering monetary and fiscal policy is difficult, as it is designed to solve one problem, but sometimes creates another with inflation (huge deficits). The Fed’s job is like trying to “thread the needle” as it begins to talk about tapering (slowing the pace and ultimately ending) bond purchases via QE, but at the same time suppress the concern of tightening monetary conditions. The Fed must communicate on both without confusing the markets. Uncertainty creates concern and volatility. Government debt is kind of like flat screen TVs over the past decade – the more inexpensive (via low interest rates), the bigger it gets.
With this backdrop, the stock market is showing signs of frustration. Frustration, expressed thru volatility, is found below the surface; but this volatility/frustration is unlikely fatal to the broader uptrend. In July, the S&P500 logged 7 more new market highs, now totaling 41 in 2021. The index advanced +2.4%, bringing the YTD return to almost +18%. The new 16-month old bull market just doubled from its low rising, +101.3%. These are amazing investment return experiences. Client portfolios shared in this market event, albeit recently at a slower pace. That’s because the index is reaching new highs on just a few “FAANG” stocks (now FAAMG), for the second time in this new bull market. Why, what is the market saying? Earlier this year, the market rise was broad with most stocks advancing to lead the market higher. The steep yield curve at the time suggested the economy was recovering and growing rapidly. Now, as growth appears more challenging, stock market rotation is back to fast-growth companies. In other words, the average stock that was more linked to accelerating economic conditions is taking a breather, with only a few stocks taking the indexes to new highs. The slower advance by the average stock also communicates erosion in risk appetite by investors; that is, softer investor sentiment (complacency) even as the trend is still upward. We expect a return back to the cyclicality names again because the economy is still expanding albeit at a slower pace. <see performance charts included in printer-friendly version via link below>
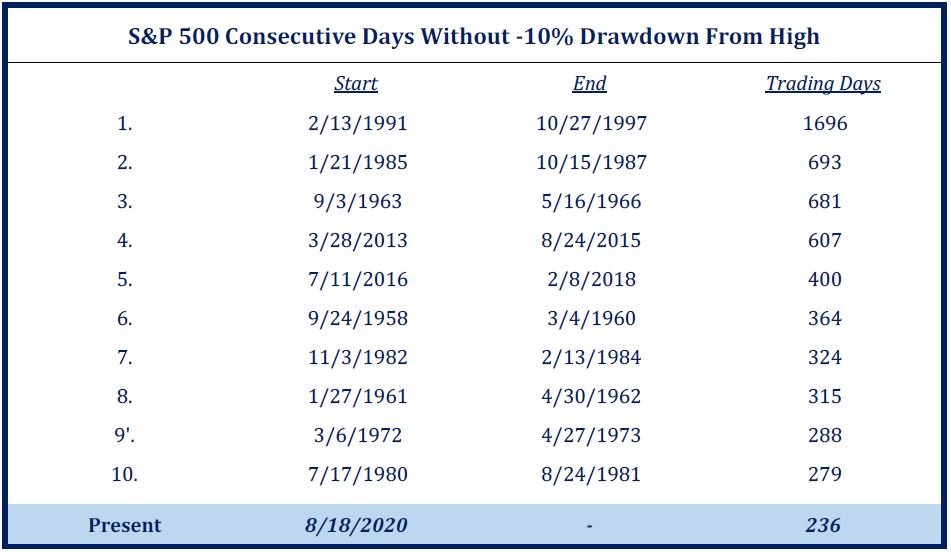
Through July, portfolio returns are attractive – like a full year’s worth! However, it would not be surprising for the markets to experience a small correction (10% or less), again because the market rise was fast and current backdrop data is peaking. The current stock market rise is 239 trading days (since August 18, 2020) without a -10% drawdown. That’s a long time, but not unprecedented (not even in the top 10 of longest streaks). For reference, the 10th longest streak lasted 279 trading days (7/17/80 to 8/24/81), while the longest endured 1696 trading days (2/13/91 to 10/27/97). Still, it would not be surprising to experience a -10% or less “breather”, but it is most difficult to predict when.
As we continue with the 2nd half of the year, the check engine light is on because of a current flat yield curve. We do not observe other more ominous warning lights at this time. It is always good to watch underlying economic fundamentals for guidance on the trend of the market. We are also aware the average bull market runs 5 years, or 60 months. This new bull market is just 16 months old; it should run a while baring any big fiscal (taxes/regulatory) or monetary (interest rates and money supply) policy mistake. But the advance should be slower than its first year rebound. Rotation of market leaders will be influenced by government policy and interest rates, and foretold by a flat or rising yield curve. We utilize a diversified mix of different style no-load mutual funds and ETFs that benefit from changing conditions. We strive to avoid allowing market emotions unnerve long-term investment principles. Key – a “check engine light” means pay attention, but don’t stop driving (keep investing).
Investment name change – Diamond Hill Corporate Credit (DSIAX) bond fund name was changed to Brandywine Corporate Credit (BCAAX) on August 2. The investment process and management team remain the same, but is owned by Brandywine Global Investment Management. The exchange was not a taxable event; the shares owned are identical. This investment in client portfolios works well; it is a short maturity corporate credit bond fund that utilizes a value orientation to own bonds that are selling cheap to the market and similar bond comparisons; a unique successful approach with a very attractive reward/risk profile.