Investment growth was furiously positive in the six months following the March lows, besting even the same interval of time following the “Great Financial Crisis” of 2008. In “Forward Expectations“, we review that while history shows the forward return pace typically slows, performance remains positive – particularly when looking +6, +12, or +24 months forward. While September reminded investors that challenges in reopening the economy persist amid covid-19, it is also good to recall that the 4th quarter is often the strongest performance season for stocks. That pattern includes election years. Should historical data not be convincing enough, we explain in “UNCH” how fundamentally significant are the “all-in” efforts of governments around the globe to support their economies. One chart monitoring change in Money Supply “may be all one needs to know” over the next few years. We should assume that uncertainty on many fronts will persist; and uncertainty results in volatility. But “Fear of Volatility” reminds investors not to confuse volatility with risk of loss (they are very different); those who do are more prone to make permanently impactful errors when investing.
Also, if interested: The Higher Wages of Growth, provides a review economic stats recently published by the US Census Bureau.
A printer-friendly version of our quarterly newsletter can be obtained here: Q3 Nvest Nsights
Forward Expectations
Investment growth was furiously positive in the 125 days from March 23. At exactly 6 months off the lows, the S&P500 generated its best ever 125-day advance, rising +48.4%. The previous best was +48.3% realized on 9/3/2009 following the “Great Financial Crisis” of 2008. On September 2 (12 trading days before the 125 day mark), the S&P set an all-time high with a whopping +61.4% climb off the March lows. This is the strongest two-quarter rally in stocks since 2009. History offers encouraging thoughts about forward returns. During the next 125 days, it is not unusual for the advance to slow its pace, adding a historical average of just +4.3% (70% of the time); +12 months forward, the historical addition averages +8.8% (74% of the time); and over +500 days (2 years), the S&P500 advances an average of +17.9% (82% of the time). Historical forward returns offer encouraging information for long-term investors. Certainly, other big market moves off the low experienced their share of noise and uncertainty boosting concerns about remaining invested.
Despite the all-time high registered on September 2, stock prices slipped during the month generating the first negative experience since the March low, declining -3.8%. Equities of all stripes and sizes corrected; value less than growth. That means 5 of the recent 6 months provided an exciting rebound. Fast market rebounds often require a pause that refreshes, setting up for further advance. History also reveals that September and early October offer seasonal challenges during most years. Nevertheless, with two of the 3 most recent months generating positive returns, 3Q stock performance was strong with a +8.9% advance.
For the YTD, which includes the huge stock market drop in February-March, returns for stocks and bonds were positive, albeit small. Bonds are winning the race at this point in the year, but their margin is shrinking – bonds returned +7.0% versus +5.6% for the S&P500 (stocks) thru September. Looking at stock style performance, a huge performance difference exists between growth (+20.7%) and value (-11.0%) styles. This huge differential is unlikely to last, as “reversion to the mean” (even compared to S&P500 index) always occurs. It also means valuations for growth are rich and stretched; maybe priced to perfection.
Why did the market show explosive recovery over the past 125 days even as COVID and the Great Lockdown provided so much uncertainty? The answer is easy – M2, or money supply. Gains were driven by Federal Reserve monetary policy; the money supply grew +23% year-over-year because the Fed provided huge economic and financial market support (low/zero interest rates and Quantitative Easing, or QE bond buying – see chart toward bottom of this post). Also the US government’s fiscal stimulus during the Great Lockdown to aid furloughed/unemployed workers and businesses, together add nearly $4 Trillion of additional money moving through the economic system. With the economy rebounding from deep lows, excess money is moving financial markets in a huge way. The same is occurring globally.
As the 4Q begins, it is good to recall that this quarter is often the strongest performance season for stocks. Like many sporting events, it’s the 4th quarter when all the drama happens, while the 3rd quarter is where the doldrums occur. The stock market is not subscribing to a 2nd lockdown scenario – new data does not support the idea and lockdown is increasingly viewed by scientists and academics as too blunt and an ineffective tool; medical knowledge and treatment is also much improved during past 6 months. Commodities, like copper, and other materials (cyclicals) are signifying economic recovery is underway and continuing, even though the recovery from this point will be jagged and more challenging to achieve; more fiscal aid may be needed to maintain economic momentum.
But what about market action in 4Q of an election year? History (since 1950) includes chaotic elections of 2000, 2008, and 2016. Those were choice elections between two new candidates that followed the 8-year terms of incumbents. Since 1950, incumbents running for re-election won 8 of 11 times. Each time an incumbent ran for re-election, the full-year market gains delivered a positive final quarter albeit similar for all 4Qs, of +4.1%. The market tends to be much calmer in election year with an incumbent running; though volatility during this election season is expected. By contrast when two newcomers vie for the Presidency, more uncertainty exists regarding future policy direction and returns are softer. Could it be that the 4Q performance is refreshing even in a year with COVID, the Great Lockdown, and more?
The message: To earn attractive returns over several years, one must remain forward invested. The huge benefit of remaining invested is the benefit of compounding returns. Investing puts a sum of money away for a period of time with the view of receiving back significantly more in the future. Compounded returns are often misunderstood, and/or their benefits forgotten. Albert Einstein said, “Compound interest is the eighth wonder of the world. He who understands it, earns it; he who doesn’t, pays it.” Compound interest is not simple interest. Exponential growth (compound interest) is difficult for the human mind to grasp. It is a geometric (multiplication) linking of returns together; not an arithmetic (addition) of returns. Successful investors know that looking forward through the “windshield” offers success compared to navigating via the “rearview mirror.” Keep your goals and expectations looking forward every day!
“UNCH”
“All in” is understood to mean all-embracing, all-inclusive, comprehensive, full, or being almost without restrictions. Being “all-in” for life (from a 2010 song by Lifehouse) shares being committed for life, even if there are difficult times which will surely occur. In another same named song by Matthew West (2017), “all-in” means there is “no turning back.” “I’m going all-in” commits to “being surrendered” and totally committed. There is little doubt regarding the outlook for global monetary policy over the next few years. The message of the Fed and other central banks is “UNCH” – unchanged for quite a while. That is significant for investors today, and over the next year or two. It may be all an investor needs to know (see the chart included at bottom of p4).
“UNCH” means domestic and global monetary policy will remain super accommodative – low/zero short-term interest rates plus QE action, as long as unemployment remains elevated; employment needs to return to the recent cycle lows between 3.5%-4%. It may take a while for a jagged economic recovery to improve in all its parts given uncertainties relating to COVID. Super accommodative means central bankers are “all-in” and will continue to pump money into the financial system to backstop, stimulate and boost economic growth. When there is excess money pushed into the financial system, the excess money (not needed by the economy to finance growth) boosts financial asset prices. Investors do not want to be out of the market (underinvested) during such times. That’s “all-in” for investors.
Following the speedy recovery of value from the March 23 market lows, many are concerned the market is disconnected to the economy. Investors show concern for valuations because the economy and earnings are not supporting current stock prices. Keep in mind that valuation multiples are poor timing tools. History reflects this valuation disconnect is normal experience – valuations look extended early because earnings are not yet showing recovery; they are bottoming. Also, unemployment lags recovery because companies do not bring on workers until they are experiencing challenges meeting increasing product and services demand. Recall, the last cycle took almost 5 years (2014) to reach the previous employment peak (of 2008), during which stocks advanced +190%. In general, stock prices bottom before economic and earnings recover by about 2 quarters on average (it took 4 quarters in 1990-91).
Current economic data indicates the US economy is improving and shows momentum. International markets show improvement, albeit slightly slower. Overall, the recovery is advancing. The financial markets are looking for additional domestic fiscal stimulus to aid progress. COVID’s economic impact is deflationary. Yet, given the magnitude of policy actions (monetary and fiscal) used to counteract it, the end result may be inflationary. Last thought: during the recent decade, global central bank balance sheets were expanded via QE policy (buying financial assets; policy was viewed as unconventional) to boost economic growth. This decade may be that the expansion of government debt is viewed acceptable. It is being pursued globally, but from our perspective it must someday be addressed, either by taxes or growing our way out of deficit spending. Be watchful in coming years; we will.
The most important message: the market recovery is underway and ongoing. With the Fed policy being “All-in” and UNCH for the foreseeable future, investors would be wise to avoid being under-invested in stocks and risk assets (even in a presidential election year). Are you UNCH regarding your investment and financial planning goals? Are you “all-in (no mental reservations)?”
“FEAR OF VOLATILITY”
Investors often confuse risk of loss with volatility. Risk of loss means investing in a stock (for example) whose value goes to zero (business failure) or is permanently impaired. By contrast, volatility is the price variation in stock prices. Sometimes volatility can rise, with prices changing quickly and unpredictably. Often that occurs with short-term market news (noise; like election year politics). Those who confuse volatility with risk of loss can end up selling at the worst time to avoid losing money. Tragically, that act of selling (to avoid loss) locks in the loss they hope to avoid. It can also mean the loss of value related to forgoing recovery and/or the future long-term positive return experiences stocks historically provide. Investors who include a diversity of investments in their portfolios should experience diminished volatility (versus owning one or a few concentrated positions), and risk of loss minimized or avoided. Nvest invests client accounts using diversification of fund strategies in asset types – bonds (fixed income) and stocks (growth) to reduce portfolio volatility and risk of permanent loss. Long term investors understand that risk diminishes with the passage of time (time IN the market is critical)!
If interested: The Higher Wages of Growth, provides a review economic stats recently published by the US Census Bureau: https://nvestwealth.com/higher-wages-of-growth_censusbureau_eco-review/.
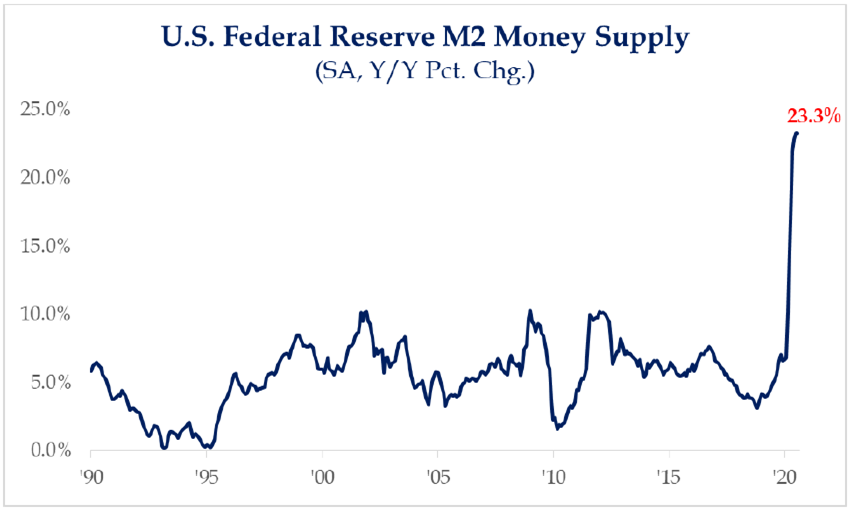
CHART FOR CONSIDERATION – M2 Money Supply Change:
As a result of enormous intervention by both the Federal Reserve and Government officials (fiscal policy), Money Supply (M2) in the US is up +23.3% y/y. With an economy that is not operating at capacity in the wake of coronavirus, much of this new money is not being used and as a result is finding its way into financial assets, lifting their prices. Investors would be wise to monitor M2 and cautious not to get too distracted by other noise.
Author of Nvest Nsights Q3’20 Articles: Bill Henderly, CFA